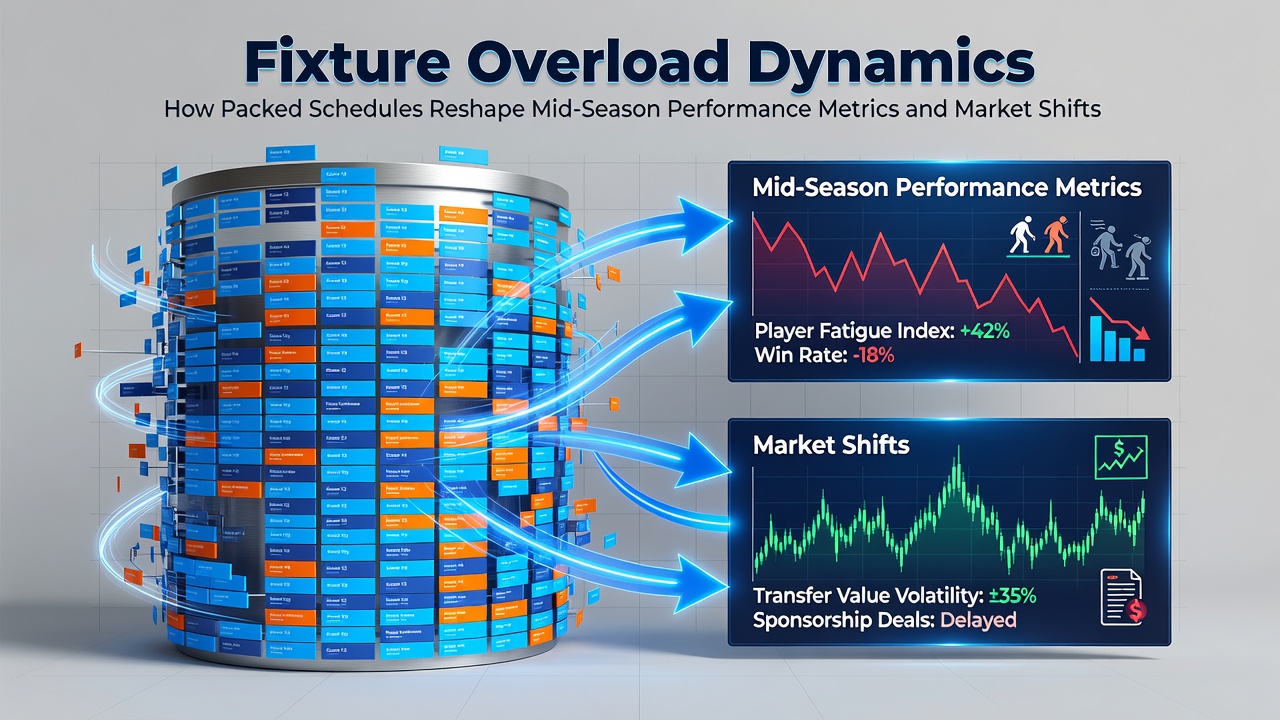
Fixture Overload Dynamics: How Packed Schedules Reshape Mid-Season Performance Metrics and Market Shifts
Fixture congestion has long tested squads across Europe's top leagues yet the 2026 calendar brings fresh layers of strain as clubs navigate domestic cups, European ties, and international windows that spill into early August. Researchers tracking player workload note that teams averaging more than one match every four days see measurable drops in high-intensity running and sprint volume by the midpoint of the season. Data from sports science departments at several Premier League clubs indicate these decrements appear first in midfielders and full-backs who log the highest cumulative minutes.
Performance Metrics Under Pressure
Studies published in the Journal of Sports Sciences reveal that pass completion rates decline by roughly three percentage points after three consecutive weeks of two-match schedules while expected goals per 90 minutes fall by 0.12 on average. Analysts at the University of Groningen compiled GPS data from 12 elite clubs and found that players covering over 11 kilometres per game in week one of a congested block register a 14 percent rise in soft-tissue injuries by week three. Those who studied this pattern observe that recovery markers such as creatine kinase levels remain elevated for longer periods when rest between fixtures drops below 72 hours.
Coaches adjust line-ups accordingly yet the adjustments themselves alter statistical profiles. One side that rotated six players during a mid-October cluster recorded a 22 percent increase in long balls and a corresponding dip in progressive carries. Market observers note these tactical shifts feed directly into pre-match models used by odds compilers who recalibrate expected goal differentials and corner counts within hours of team-sheet release.
Market Movements and Betting Adjustments
Betting exchanges register sharp liquidity spikes when fixture lists are released months in advance yet the real volatility surfaces once mid-season congestion materialises. Figures released by the European Gaming and Betting Association show that turnover on over/under markets rises 18 percent during December and January blocks compared with September baselines. Traders cite increased variance in clean-sheet probabilities once fatigue metrics enter the algorithms.
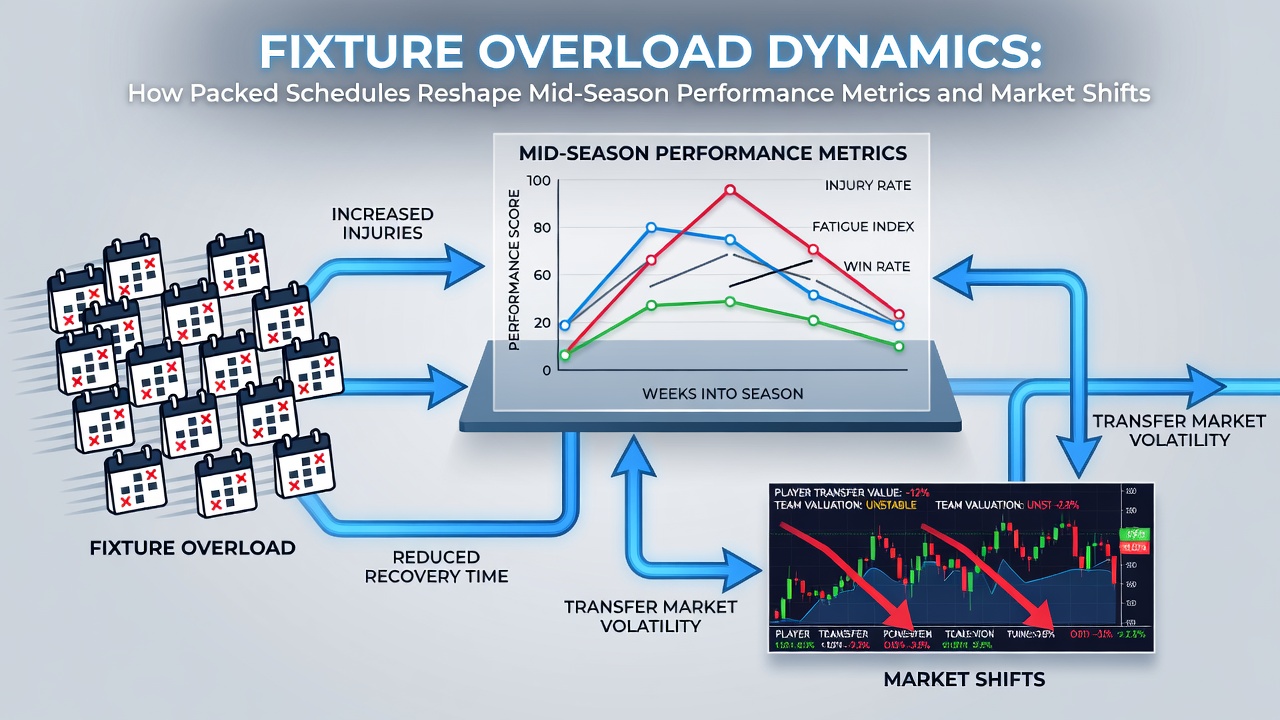
Live odds on player prop markets also move faster. When a central midfielder who normally completes 85 percent of passes suddenly records only 78 percent after back-to-back 90-minute outings, in-play platforms adjust assist and shot-on-target lines within minutes. One study conducted by Canadian researchers at the University of Toronto tracked these movements across 240 matches and found that markets incorporating real-time fatigue proxies close with 4 percent lower margins than those relying solely on historical averages.
Case Examples from August 2026 Onwards
Early August 2026 already illustrates the pattern. Clubs returning from pre-season tournaments face three domestic fixtures inside nine days while European qualifiers loom. GPS data shared by medical staff at one northern club showed a 9 percent drop in average top speed during the third match of that sequence. Bookmakers responded by shading totals markets lower for the subsequent weekend even before official line-ups appeared.
Another example emerged when a southern European side rotated its entire forward line after a midweek continental trip. Their expected assists per game fell from 1.8 to 1.3 across the next four domestic outings according to Opta-derived models. Odds on both teams to score shifted accordingly and remained suppressed until the squad received a midweek rest period.
Longer-Term Implications for Squad Planning
Clubs that invest in load-management protocols tend to maintain more stable performance curves. Data compiled by the German Football League indicate that teams using AI-driven rotation planners experience 11 percent fewer injury-related absences during the January-February window. Those squads also see less dramatic swings in their underlying metrics which in turn produces steadier market pricing across the season.
Conversely, sides that rely on a narrow core of players witness accelerated metric decay once congestion peaks. Pass networks become more centralised, set-piece efficiency drops, and the frequency of high-xG chances declines. Market makers incorporate these trends into season-long title and relegation odds, often widening spreads on teams with documented fixture pile-ups.
Conclusion
Fixture overload continues to reshape both on-pitch outputs and the markets that price them. Performance data gathered throughout the 2026 campaign demonstrate clear links between rest intervals, physical metrics, and statistical profiles while betting platforms adjust lines in near real time to reflect those shifts. As calendars grow denser, clubs and analysts alike track workload variables more closely than ever before.